Charts
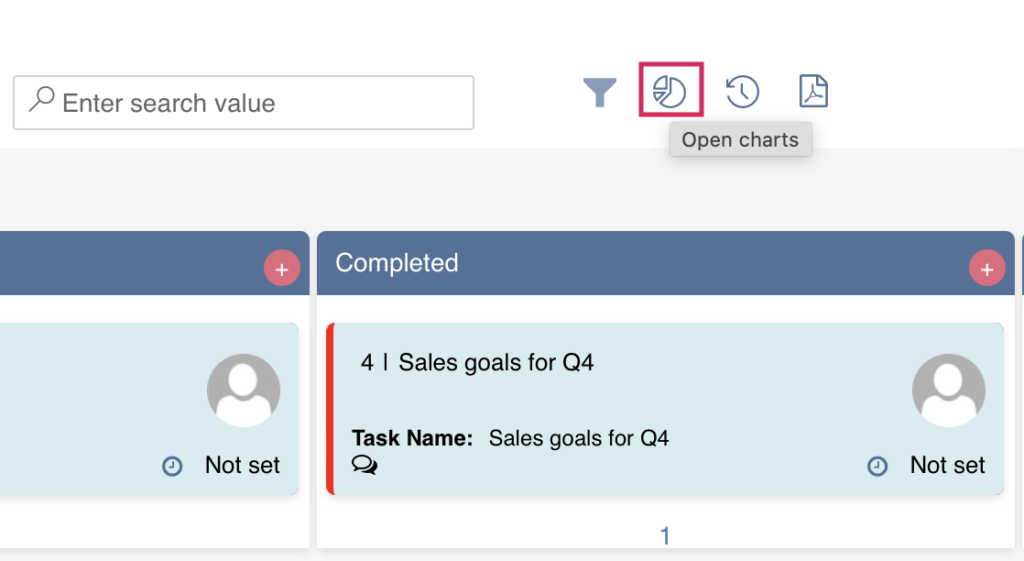
The charts in Virto Kanban Board allow you to analyze your tasks as needed. Click the charts icon in the top right corner to open the chart view.
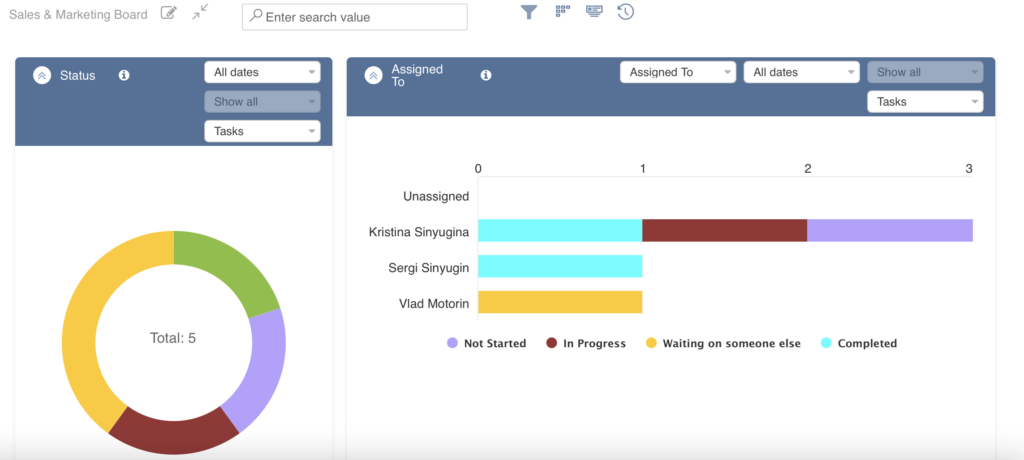
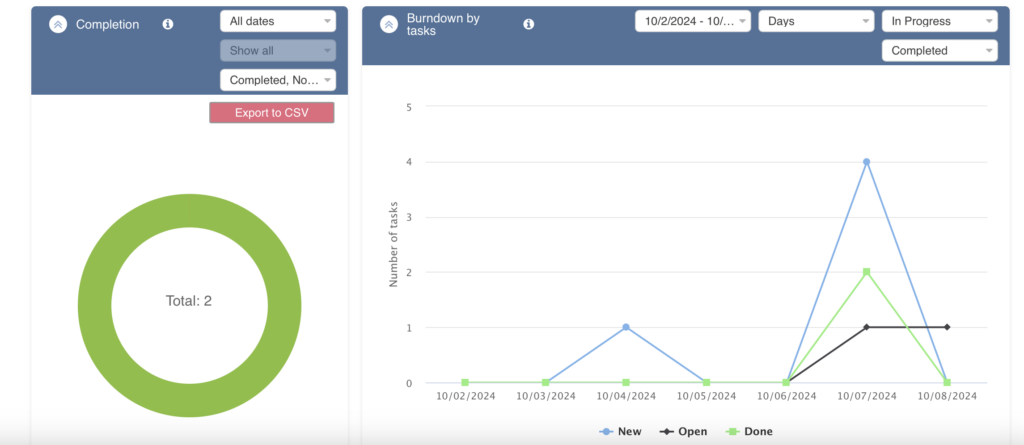
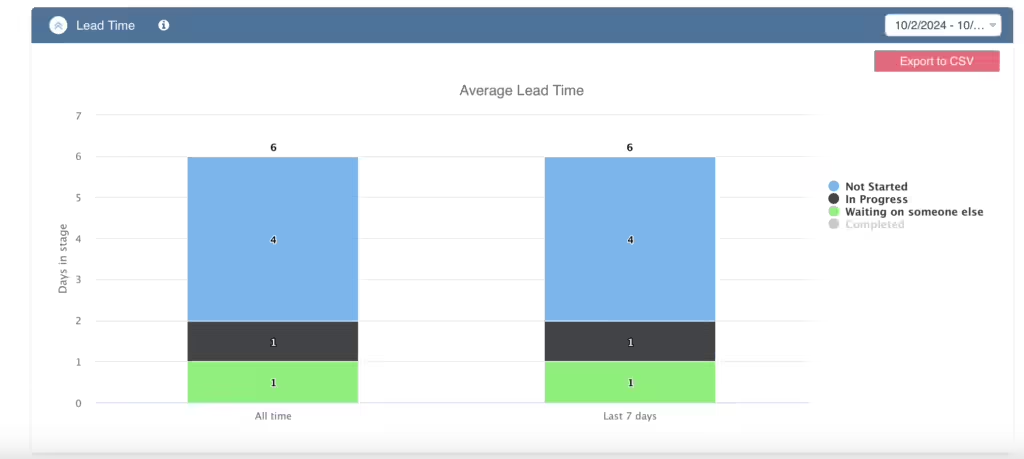
Here, you can view task statistics displayed in five graphs: “Status,” “Assigned To,” “Completion,” “Burndown,” and “Lead Time.”